Saturday, June 25, 2022

Arctic Ocean Methane is being Released from Clathrates by Warming Arctic Ocean off Siberia. Jorma Archival Posts

Rising Arctic Ocean temperatures cause gas hydrate destabilization and ocean acidification A. Biastoch, 1 T. Treude, 1 L. H. Rüpke, 1 U. Riebesell, 1 C. Roth, 1 E. B. Burwicz, 1 W. Park,1 M. Latif, 1 C. W. Böning, 1 G. Madec, 2 and K. Wallmann 1 Received 21 February 2011; accepted 8 March 2011; published 16 April 2011. https://oceanrep.geomar.de/id/eprint/13116/1/2011_Biastoch_etal_GRL_2011GL047222.pdf [ 1 ] Vast amounts of methane hydrates are potentially stored in sediments along the continental margins, owing their stability to low temperature – high pressure conditions. Global warming could destabilize these hydrates and cause a release of methane (CH 4 ) into the water column and possibly the atmosphere. Since the Arctic has and will be warmed considerably, Arctic bottom water temperatures and their future evolution projected by a climate model were analyzed. The resulting warming is spatially inhomogeneous, with the strongest impact on shallow regions affected by Atlantic inflow. Within the next 100 years, the warming affects 25% of shallow and mid‐depth regions containing methane hydrates. Release of methane from melting hydrates in these areas could enhance ocean acidification and oxygen depletion in the water column. The impact of methane release on global warming, however, would not be significant within the considered time span. Citation: Biastoch, A., et al. (2011), Rising Arctic Ocean temperatures cause gas hydrate destabiliza- tion and ocean acidification, Geophys. Res. Lett., 38, L08602, doi:10.1029/2011GL047222.
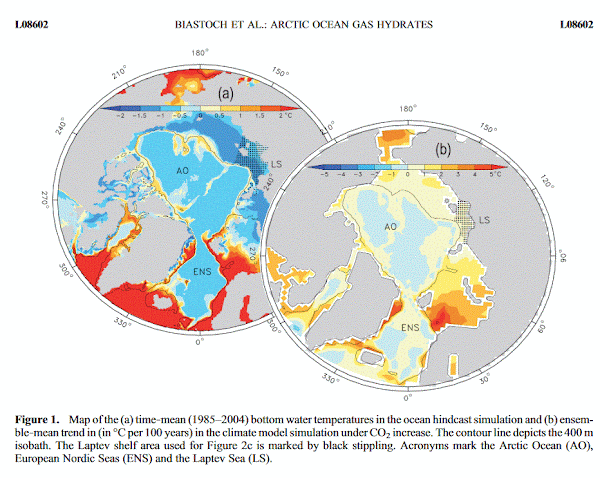
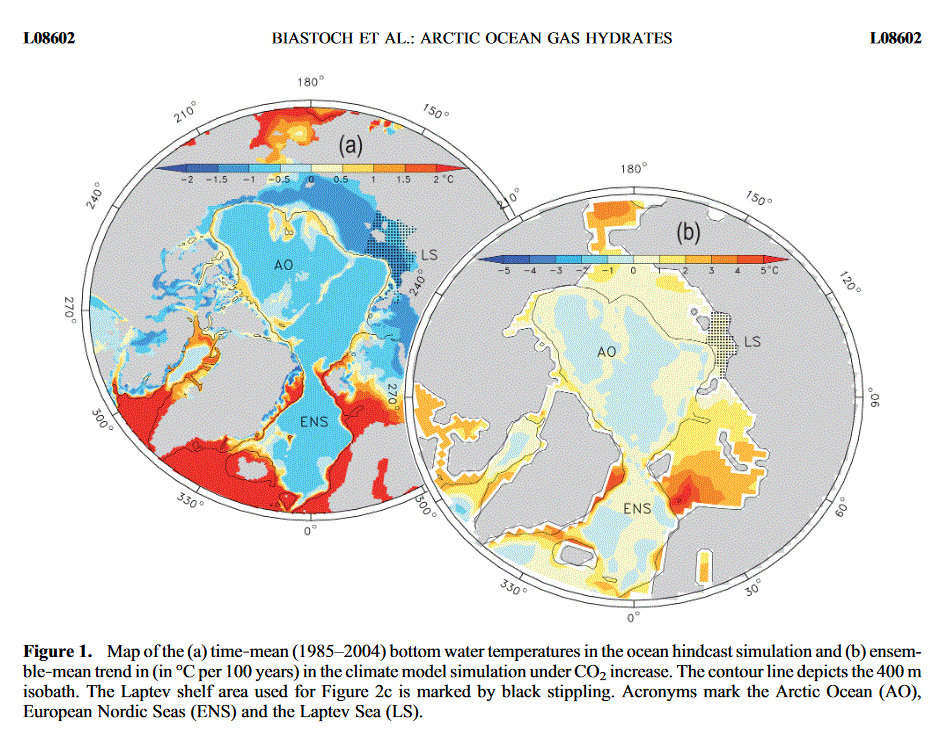
1. Introduction [ 2] Formed under low temperature – high pressure con- ditions [Tishchenko et al., 2005] vast amounts of methane hydrates are considered to be locked up in sediments of continental margins [Buffett and Archer, 2004; Klauda and Sandler, 2005]. In the Arctic Ocean (AO), hydrates are deposited at shallow water depths close to shelf edges, stabilized by year‐round cold temperatures [Hester and Brewer, 2009]. Because the Arctic has warmed consider- ably during the recent decades and because climate models predict accelerated warming if global greenhouse gas emissions continue to rise [Intergovernmental Panel on Climate Change (IPCC), 2007], a destabilization of shallow Arctic hydrate deposits has been debated [Reagan and Moridis, 2007; Kerr, 2010]. Methane (CH 4 ), a gas with a global warming potential ∼25 times higher than CO2 [IPCC, 2007], could be released from the melting hydrates and enter the water column and atmosphere [Krey et al., 2009]. Recent field studies indicate an increase in methane fluxes from submarine Arctic permafrost and the seafloor [Westbrook et al., 2009; Shakhova et al., 2010]. Our multi‐disciplinary analysis provides a closer look into regional developments of submarine Arctic gas hydrate deposits under future global warming scenarios and reveals where and over which time scales gas hydrates could be destabilized and affect oceanic pH, oxygen, and atmospheric methane. 2. Temperature Evolution in the Mid‐depth Arctic Ocean [ 3 ] For an evaluation of the general distribution and the natural variability we investigated the spatio‐temporal vari- ability of Arctic bottom water in a hindcast experiment with the ocean/sea‐ice model NEMO (v2.3) [Madec, 2006], carried out by the DRAKKAR collaboration [The DRAKKAR Group, 2007]. The global simulation was performed at 1/2° reso- lution (ORCA05) and 46 levels in the vertical, whereby partial bottom cells allowed realistic topographic slopes. The experiment, that demonstrated its fidelity in simulating the salient features of the Atlantic circulation variability [Biastoch et al., 2008], was forced by inter‐annually varying atmospheric boundary conditions of the past decades [Large and Yeager, 2004]. To exclude a potential model drift in the water masses a second experiment under repeated‐year forcing was subtracted from the hindcast. The bottom water temperatures to first order reflect water depth (Figure 1a), featuring colder values around 0°C below 1000 m and warmer values on the shelves. However, a clear impact of the ocean circulation is seen as a band of temperatures around 1°C surrounding the AO at ∼400 m, an expression of the Atlantic inflow below the Arctic halocline [Polyakov et al., 2004]. Colder temperatures appear on the Russian and Canadian shelves due to the exposure of the surface waters to continental cold air outbreaks during winter. [ 4 ] The Atlantic inflow from the European Nordic Seas (ENS) into the AO exhibits pronounced variability on decadal time scales [Biastoch et al., 2008], following tem- perature and transport changes in the branch of the North Atlantic Current flowing through the ENS [Holliday et al., 2008]. The flow of Atlantic water towards the AO south of Svalbard (Figure 2a) shows a remarkable consistency with observations, both in mean temperature (3.70 ± 0.60°C vs. 3.96 ± 0.69°C [Holliday et al., 2008]) and variability, with minima in the late 1970s, mid 1980s and late 1990s. Changes towards warmer temperatures were reported for the past few decades [Holliday et al., 2008], which are sup- ported by the simulated long‐term trend (0.014°C yr−1 ). Although the long‐term trend (<0.005°C yr−1 ) of the bottom water is weaker (Figure 2b), a decadal variability by the Atlantic inflow is also present: changes over a single pentad repeatedly reach 0.75°C (red lines). The inflow signal extends to the shelf areas off Russia as part of the cyclonic circu- 1 Leibniz-Institut fu ̈r Meereswissenschaften an der Universita ̈ t Kiel (IFM-GEOMAR), Kiel, Germany. 2 Laboratoire d’Oce ́ anographie et du Climat: Expe ́ rimentation et Approches Nume ́ rique, Paris, France. Copyright 2011 by the American Geophysical Union. 0094‐8276/11/2011GL047222 GEOPHYSICAL RESEARCH LETTERS, VOL. 38, L08602, doi:10.1029/2011GL047222, 2011 L08602 1 of 5 lation around the AO [Dmitrenko et al., 2008]. Although the Arctic Intermediate Water also varies on a decadal time scale [Polyakov et al., 2004], bottom water temperatures along the Russian slope remain almost unaffected (Figure 2c). Only the shallow and potentially methane‐rich [Shakhova et al., 2010] shelf regions in the Laptev Sea show significant annual variations. [ 5] The future evolution of bottom water temperatures was analyzed in an ensemble of greenhouse warming integrations with a coupled climate model (KCM) [Park et al., 2009]. This configuration utilizes the same numerical framework, but at lower resolution (ORCA2, 2° horizontally, 31 levels) and the atmospheric model ECHAM5 [Roeckner et al., 2003] as an active atmosphere. In addition to a 430 year control experiment with present day greenhouse gas con- centrations (CO 2 = 348 ppm), an ensemble of eight 100‐year long global warming simulations, each starting from dif- ferent states of the control run, were performed with 1% increase in the CO 2 equivalent concentration [Park et al., 2009]. The linear trend of the ensemble average was com- bined with the ORCA05 distribution. The temperature changes (Figure 1b) show a highly inhomogeneous distri- bution, with increases of 1–2°C along the continental slopes and even higher values on the shelves due to the direct influence from the atmosphere. Individual ensemble mem- bers resembles strong inter‐annual to decadal variability in the Nordic Seas (Figure S1 in Text S1 of the auxiliary material) due to different states of the Atlantic Ocean circulation, but all feature a consistent long‐term trend of 2.5°C per cen- tury.1 Anomalies take some decades to protrude into the Laptev Sea, depending on the state of the Arctic circulation [Polyakov et al., 2004]; consistent trends are starting typi- cally after 50 years. 3. Impact on Methane Hydrate Stability and Ocean Acidification [ 6 ] Methane hydrate stability in marine sediments is mainly a function of temperature and pressure [Tishchenko et al., 2005]. A thermodynamic analysis (Figure 3b) of selected Arctic regions illustrates that in the ENS the methane hydrate will experience a phase shift from hydrate to free gas in mid‐depth levels at around 500 m within the next 100 years. Natural decadal variability can easily add another 0.75°C (Figure 2) to the long‐term increase. Along the Russian slope only shallower depths (∼300 m) undergo a phase shift. [ 7 ] For the overall impact of future bottom water warming on the stability of methane hydrates potentially stored in the Arctic seafloor we explored the thickness of the gas hydrate Figure 1. Map of the (a) time‐mean (1985–2004) bottom water temperatures in the ocean hindcast simulation and (b) ensem- ble‐mean trend in (in °C per 100 years) in the climate model simulation under CO 2 increase. The contour line depicts the 400 m isobath. The Laptev shelf area used for Figure 2c is marked by black stippling. Acronyms mark the Arctic Ocean (AO), European Nordic Seas (ENS) and the Laptev Sea (LS). 1 Auxiliary materials are available in the HTML. doi:10.1029/ 2011GL047222. BIASTOCH ET AL.: ARCTIC OCEAN GAS HYDRATES L08602L08602 2 of 5 stability zone (GHSZ) below the seafloor. The GHSZ is defined as that part of a sediment column where hydrostatic fluid pressures are higher than the temperature and salinity dependent dissociation pressure of gas hydrates. The dis- sociation pressure was calculated according to Tishchenko et al. [2005] using the fields from the ocean model and steady‐state temperatures computed from global heat flow values in combination with an average sediment conduc- tivity of 1.5 W m−1 K−1 for present (Figure S2) and future climates (Figure 3a). To roughly estimate the amount of hydrate within the GHSZ we used simple constant mean hydrate pore filling estimates of 2.4% (60–70°N) to 6.1% (north of 70°N) based on ODP data and numerical modeling [Klauda and Sandler, 2005]. Inhibition of hydrate formation by sulfate reduction is approximated by including a 5 m thick hydrate free zone below the seafloor. Assuming a mean porosity of 0.5 and standard values for density and methane content of hydrate, we estimated a total inventory of 900 Gt carbon (C) north of 60°N for the present climate. This value is not too far off the estimated 500 Gt C based on studies offshore Alaska [Kvenvolden, 1988] representing a fraction of the still largely unknown global hydrate inventory of 500–64,000 Gt C [Hester and Brewer, 2009]. Under the global warming scenario most affected regions are distributed around the AO and the ENS. Areas exhibiting decreases ≥20 m in the GHSZ thickness sum up to a total size of ∼850,000 km2 resulting in a total methane release of ∼100 Gt C. However, these estimates are too high for the considered 100‐year time window and need to be adjusted for the sluggish diffusion of heat into marine sediments. Using a constant thermal diffu- sivity of 4 × 10⁷ m s−2 and neglecting the latent heat of hydrate melting, we find that only 12% of the worst‐case hydrate volume is reduced after 100 years for sulfate reduction zone thicknesses 5 m (Figure 3c). Note that sensitivity runs with 0 and 10 m sulfate reduction zone thicknesses show reductions of 14 and 10%, respectively. [ 8 ] What could happen to the released methane? It is conceivable from environmental hydrate studies that, depending on the release rate, at least ∼50% of the methane that dissolves into the sediment porewater, could be retained inside the seafloor by microbial anaerobic oxidation of methane (AOM) [Knittel and Boetius, 2009; Treude et al., 2003]. AOM represents a long‐term sink for methane‐ derived carbon, converting methane into bicarbonate and eventually precipitating it as authigenic carbonates [Peckmann et al., 2001]. However, methane rising through sediments as free gas could bypass the benthic methane filter [Knittel and Boetius, 2009] and, depending on water depth [McGinnis et al., 2006], immediately reach the atmosphere. Methane that on the other hand dissolves into the water column could be utilized by microbial aerobic oxidation of methane [Valentine et al., 2001]. Different to its counterpart AOM in sediments, aerobic oxidation of methane converts methane with oxygen into CO2 – a molecule that can impact oceanic pH. [ 9 ] For the following scenario we assume that 50% of the methane from the transient GHSZ thickness change is released into the water column and consumed by aerobic methanotrophs. A Lagrangian analysis of the oceanic cur- rents (auxiliary material) shows that (within a given year) the bulk of the water affected by methane is kept within 100 m above the bottom and along the mid‐depth topographic slope. Changes in seawater carbonate chemistry were cal- culated by adding the microbial produced CO2 to the back- ground dissolved inorganic carbon (auxiliary material). Some areas of the AO revealed pH values to drop by up to 0.25 units (Figure 4) within the next 100 years. Additionally, the aerobic consumption of methane could locally decrease bottom water oxygen concentrations by up to 25% (auxiliary material, data not shown). Regional methane‐induced sea- water acidification from the seafloor would occur in addition to an ocean‐wide acidification caused by the uptake of anthropogenic CO 2 from the atmosphere [IPCC, 2007]. The combined effect of the two processes would accelerate ocean acidification in parts of the AO, including deeper waters which otherwise would be exposed to ocean acidification with a considerable time delay. Research on that topic so far has been conducted under the premises of a projected pH decrease due to the anthropogenic CO 2‐uptake of about 0.3 units until the end of this century. Methane‐induced acidi- fication could nearly double this decrease in parts of the AO. [ 10] If, in a rather unrealistic scenario, all of the liberated methane would reach the atmosphere, global warming could be amplified [Bartdorff et al., 2008]. Under transient con- ditions we estimated an additional average methane flux of only 162 Mt CH4 yr−1 from melting Arctic hydrates over the next 100 years (auxiliary material) – a value lower than the current anthropogenic input of (600 Mt yr−1 ) [Bartdorff et al., 2008]. Sensitivity experiments with the climate model confirm the negligible feedback of the climate system under Figure 2. Variability of temperatures in the hindcast simu- lation, shown by monthly and inter‐annually filtered tem- peratures of (a) the Atlantic inflow (50–200 m depth) off Svalbard and bottom water temperatures (b) along the east- ern continental slope in the ENS off Svalbard and Norway (water depth 416–793 m) and (c) along the Russian conti- nental slope, (black, 416–793 m, 90–180°E) and on the shelf (blue, 0–100 m) in the Laptev Sea. The red lines mark trends in particular 5‐year periods. BIASTOCH ET AL.: ARCTIC OCEAN GAS HYDRATES L08602L08602 3 of 5 this limited additional amount of methane (Figure S3). On a longer time scale, however, the transient heat conduction leads to a faster methane release; the methane released from the steady‐state GHSZ calculation causes an upper limit of 0.8°C increase in surface air temperature on top of global warming. 4. Conclusions [ 11] The present study is to our knowledge the first combining ocean hindcasts and future climate projections with GHSZ calculations and potential consequences. It should be noted that the overall model still has its limitation with respect to the resolution of the bottom water tem- peratures, the actual distribution of sub‐seafloor methane hydrates and the individual response of the microbial com- munity in the sediment and water column. Nevertheless, the study clearly shows that hydrate destabilization can occur in the Arctic in response to global warming, and that the potential methane release is substantial, but limited in the next 100 years. An important finding is that warming and variability of the Atlantic inflow will play a major role in the fate of Arctic gas hydrates. Recent observations [Westbrook et al., 2009; Reagan and Moridis, 2009] agree well with sensitive areas identified here. Our maps could represent a useful tool in identifying areas around the Arctic Ocean where increases in methane release are likely to occur now or in the near future. [ 12 ] Acknowledgments. This research was part of the Custer of Excellence “The Future Ocean” funded by the German Research Founda- tion (DFG). The integrations of the experiments have been performed at the Computing Centre at Kiel University. [ 13] The Editor thanks one anonymous reviewers for their assistance in evaluating this paper. Figure 4. Changes in pH due to the release of 50% of the methane from hydrates within the first 100 years and distrib- uted over the first 100 m above the bottom. Figure 3. (a) Changes in thickness of the GHSZ caused by temperature increase of the ensemble mean of the global warm- ing, (b) phase diagram of methane hydrate as a function of pressure and temperature (constant salinity of S = 35 p.s.u.). Open symbols mark the bottom water temperatures along the ENS (cycles) and Russian (squares) slopes in the present cli- mate run, closed symbols the greenhouse warming experiments. Vertical bars indicate the vertical resolution of the ocean model. (c) Volumetric GHSZ thickness changes north of 60°N as a function of time. A value of 100% corresponds to the worst case scenario. The shaded range marks estimates for 0 and 10 m sulfate reduction zone thickness. BIASTOCH ET AL.: ARCTIC OCEAN GAS HYDRATES L08602L08602 4 of 5 References Bartdorff, O., K. Wallmann, M. Latif, and V. Semenov (2008), Phanero- zoic evolution of atmospheric methane, Global Biogeochem. Cycles, 22, GB1008, doi:10.1029/2007GB002985. Biastoch, A., C. W. Böning, J. Getzlaff, J.‐M. Molines, and G. Madec (2008), Causes of interannual‐decadal variability in the meridional over- turning circulation of the mid‐latitude North Atlantic Ocean, J. Clim., 21, 6599–6615, doi:10.1175/2008JCLI2404.1. Buffett, B., and D. Archer (2004), Global inventory of methane clathrate: Sensitivity to changes in the deep ocean, Earth Planet. Sci. Lett., 227, 185–199, doi:10.1016/j.epsl.2004.09.005. Dmitrenko, I. A., I. V. Polyakov, S. A. Kirillov, L. A. Timokhov, I. E. Frolov, V. T. Sokolov, H. L. Simmons, V. V. Ivanov, and D. Walsh (2008), Toward a warmer Arctic Ocean: Spreading of the early 21st century Atlantic Water warm anomaly along the Eurasian Basin margins, J. Geo- phys. Res., 113, C05023, doi:10.1029/2007JC004158. Hester, K., and P. Brewer (2009), Clathrate hydrates in nature, Annu. Rev. Mar. Sci., 1, 303–327, doi:10.1146/annurev.marine.010908.163824. Holliday, N. P., et al. (2008), Reversal of the 1960s to 1990s freshening trend in the northeast North Atlantic and Nordic seas, Geophys. Res. Lett., 35, L03614, doi:10.1029/2007GL032675. Intergovernmental Panel on Climate Change (IPCC) (2007), Climate Change 2007: The Physical Science Basis. Contribution of Working Group I to the Fourth Assessment Report of the Intergovernmental Panel on Climate Change, edited by S. Solomon et al., Cambridge Univ. Press, Cambridge, U. K. Kerr, R. (2010), “Arctic Armageddon” needs more science, less hype, Science, 329, 620–621, doi:10.1126/science.329.5992.620. Klauda, J. B., and S. I. Sandler (2005), Global distribution of methane hydrate in ocean sediment, Energy Fuels, 19, 459–470, doi:10.1021/ ef049798o. Knittel, K., and A. Boetius (2009), Anaerobic oxidation of methane: Prog- ress with an unknown process, Annu. Rev. Microbiol., 63, 311–334, doi:10.1146/annurev.micro.61.080706.093130. Krey, V., et al. (2009), Gas hydrates: Entrance to a methane age or climate threat?, Environ. Res. Lett., 4, 034007, doi:10.1088/1748-9326/4/3/ 034007. Kvenvolden, K. A. (1988), Methane hydrates and global climate, Global Biogeochem. Cycles, 2, 221–229, doi:10.1029/GB002i003p00221. Large, W. G., and S. G. Yeager (2004), Diurnal to decadal global forcing for ocean and sea‐ice models: The data sets and flux climatologies, NCAR Tech. Note NCAR/TN‐460+STR, Natl. Cent. for Atmos. Res., Boulder, Colo. Madec, G. (2006), Nemo ocean engine, note du pole de modelisation, Tech. Rep. 27, Inst. Pierre Simon Laplace, Paris. McGinnis, D. F., J. Greinert, Y. Artemov, S. E. Beaubien, and A. Wüest (2006), Fate of rising methane bubbles in stratified waters: How much methane reaches the atmosphere?, J. Geophys. Res., 111, C09007, doi:10.1029/2005JC003183. Park, W., N. Keenlyside, M. Latif, A. Ströh, R. Redler, E. Roeckner, and G. Madec (2009), Tropical Pacific climate and its response to global warming in the Kiel Climate Model, J. Clim., 22, 71–92, doi:10.1175/ 2008JCLI2261.1. Peckmann, J., A. Reimer, U. Luth, C. Luth, B. T. Hansen, C. Heinicke, J. Hoefs, and J. Reitner (2001), Methane‐derived carbonates and authigenic pyrite from the northwestern Black Sea, Mar. Geol., 177, 129–150, doi:10.1016/S0025-3227(01)00128-1. Polyakov, I., G. Alekseev, L. Timokhov, U. Bhatt, R. Colony, H. Simmons, D. Walsh, J. Walsh, and V. Zakharov (2004), Variability of the interme- diate Atlantic water of the Arctic Ocean over the last 100 years, J. Clim., 17, 4485–4497, doi:10.1175/JCLI-3224.1. Reagan, M. T., and G. J. Moridis (2007), Oceanic gas hydrate instability and dissociation under climate change scenarios, Geophys. Res. Lett., 34, L22709, doi:10.1029/2007GL031671. Reagan, M. T., and G. J. Moridis (2009), Large‐scale simulation of meth- ane hydrate dissociation along the West Spitsbergen Margin, Geophys. Res. Lett., 36, L23612, doi:10.1029/2009GL041332. Roeckner, E., et al. (2003), The atmospheric general circulation model ECHAM5: Part 1. Model description, Rep. 349, Max Planck Inst. for Meteorol., Hamburg, Germany. Shakhova, N., I. Semiletov, A. Salyuk, V. Yusupov, D. Kosmach, and O. Gustafsson (2010), Extensive methane venting to the atmosphere from sediments of the East Siberian Arctic Shelf, Science, 327, 1246–1250, doi:10.1126/science.1182221. The DRAKKAR Group (2007), Eddy‐permitting ocean circulation hind- casts of past decades, CLIVAR Exchanges, 12, 8–10. Tishchenko, P., C. Hensen, K. Wallmann, and C. S. Wong (2005), Calcu- lation of the stability and solubility of methane hydrate in seawater, Chem. Geol., 219, 37–52, doi:10.1016/j.chemgeo.2005.02.008. Treude, T., A. Boetius, K. Knittel, K. Wallmann, and B. Jørgensen (2003), Anaerobic oxidation of methane above gas hydrates at Hydrate Ridge, NE Pacific Ocean, Mar. Ecol. Prog. Ser., 264, 1–14, doi:10.3354/ meps264001. Valentine, D. L., D. C. Blanton, W. S. Reeburgh, and M. Kastner (2001), Water column methane oxidation adjacent to an area of active hydrate dis- sociation, Eel River Basin, Geochim. Cosmochim. Acta, 65, 2633–2640, doi:10.1016/S0016-7037(01)00625-1. Westbrook, G. K., et al. (2009), Escape of methane gas from the seabed along the West Spitsbergen continental margin, Geophys. Res. Lett., 36, L15608, doi:10.1029/2009GL039191. A. Biastoch, C. W. Böning, E. B. Burwicz, M. Latif, W. Park, U. Riebesell, C. Roth, L. H. Rüpke, T. Treude, and K. Wallmann, Leibniz‐Institut für Meereswissenschaften an der Universität Kiel (IFM‐GEOMAR), Düsternbrooker Weg 20, D‐24105 Kiel, Germany. (abiastoch@ifm‐ geomar.de) G. Madec, Laboratoire d’Océanographie et du Climat: Expérimentation et Approches Numérique, 4, place Jussieu, F‐7525 Paris CEDEX 05, France. BIASTOCH ET AL.: ARCTIC OCEAN GAS HYDRATES L08602L08602 5 of 5

Climate Change Adaptation in the Okanagan Conference. Kelowna BC. May 31, 2002. Jorma Jyrkkanen's Notes.

Beyond Emissions. Kelowna Climate Change Forum Synopsis. Beyond Emissions: Climate Change Forum; What Can We Expect From Climate Change? May 30th and May 31st 2002; Kelowna BC
The following are my notes from the Forum, and submissions by Presenters so by all means go to the source for definitive works. Thursday, May 30 at OUC KLO Campus Theater 7:00 PM Introduction 7:15: Wendy Avis, Environment Canada-Canada’s climate change status and programs. The positions are well covered and critiqued by Author Guy Dauncy below. The Canadian government is looking for inputs from Canadians this summer in an effort to firm up its position. Downloadable copies of Canada Position with Emission Data and Trends; Also Resources for Action and Draft Plan for Kyoto (New on Oct. 24th, 2002): http://www.climatechange.gc.ca http://www.ec.gc.ca/pdb/ghg/ghg_docs/gh_eng.pdf 7:30 Jenny Fraser, jenny.fraser@gems8.gov.bc.ca Climate Change Section, Ministry of Water, Land and Air Protection topic: Impacts of climate change during the 21st Century-An overview of changes in temperature, precipitation, and impacts on related systems across BC. The study concurs that climate change is happening and graphs of CO2 and temperature going back 1000 years confirm the trends and show that the major changes have happened since the industrial revolution. Provincial trends demonstrate statistically significant trends in most climate change parameters that were considered with generally higher levels in parameters further north. The 'noise' created by El Nino, La Nina, and the Pacific decadal oscillation (PDO) were filtered by examination of time trends to extract climate change influences. Past impacts from 100 years of historical data and projections for the next century are that: 1. Average annual temperature warmed by 0.6 deg C on the coast, 1.1 deg C in the interior, 1.7 deg C in northern BC. Averge overall to increase by 1 to 4 deg C. 2. Night-time temperatures increased across most of BC in spring and summer. [Will probably increase-JJ] 3. Precipitation increased by 2 to 4 % per decade. It may increase by 10 to 20%. 4. Lakes and rivers became free of ice earlier in the spring. Some interior rivers may dry up during summer and early fall. 5. Sea level temperatures increased by 0.9 deg C to 1.8 deg C along the BC coast. [Will probably increase-JJ] 6. Sea level rose by 4 to 12 cm along most of the BC coast. [Will probably increase-JJ] 7. The Fraser river discharges more of its annual flow earlier in the years. [Will probably get even earlier-JJ] 8. Water in the Fraser river is warmer in summer. Salmon migration patterns are likely to change. 9. More heat energy is available for plant and insect growth. The mountain pine beetle is likely to expand its range. 10. Two large BC glaciers retreated by more than a kilometre each. Small ones are expected to disappear in the next century. Climate change may influence the frequency of extreme weather events, extent of permafrost, ecosystem structures and processes, species distribution and survival. All of this will have effects on fish, wildlife, plant and human society. [For example, though they don't mention it, in BC coastal waters, we are finding tropical predatory fish for the first time, and Cattle Egrets from Africa in Squamish, and on Vancouver Island, the deadly tropical disease, Cryptococcus neoformans while in the Niagra area of Ontario, West Nile Virus. These findings suggest climate change influences on range expansion of beneficial species as well as pathogens. For info on El Nino and PDO-JJ] http://eos-chem.gsfc.nasa.gov/instruments/mls/elnino.html http://tao.atmos.washington.edu/pdo/graphics.html http://www.cpc.ncep.noaa.gov/products/analysis_monitoring/enso_update/gsstanim.html Downloadable copies of detailed study located at: http://www.gov.bc.ca/wlap http://wlapwww.gov.bc.ca/air http://wlapwww.gov.bc.ca/air/climate/index.html#indicators 7:45 Tina Neale, tneale@sdri.ubc.ca Sustainable Development Research Institute UBC Potential impacts of climate change on water resources in the Okanagan based on 2001 research paper 'Water Management and Climate Change in the Okanagan Basin' by Stewart Cohen and Tanuja Kulkarni. Environment Cda and UBC. Development of climate change impact scenarios on hydrology in 2002 and 2004. Temperature to rise 1-2.5 deg C from 1961-1990 base period to the 2020's, and 3-5 deg C by 2080's. Higher precipitation is expected for winter, but models differ on what will happen in summer. Recent warming has led to changes in stream flow. Observed changes in unregulated streams include earlier onset of the annual spring peak by as much as four to six weeks, lower peak volumes, lower fall flows and higher early winter flows with all areas showing loss of winter snowpack. Regulated streams are showing decreases in discharge. Earlier peak flows and lower flows in lower elevations streams with low late summer flows. In higher elevation streams there may be more water or the same but flow timing is affected. No consensus on scenario changes to total annual flows. Structural measures were options chosen by stake holders when considering adaptation mechanisms and comments indicated a need for more research and outreach. Copies of study available at (2.676K pdf format): http://www.sdri.ubc.ca http://www.sdri.ubc.ca/documents/Water_Management_and_Climate_Change_in_the_Okanagan_Basin.pdf 8:15 Dr. Milt McLaren, SFU Professor Emeritus, Climate Change Education-Why is it difficult to teach about climate change? We need timely public response to this issue. Why is this so challenging? Misconceptions abound and we don't need more science to prove anything. We just need to present existing findings in a way that people can understand so that misconceptions are cleared up. Most troubling were his comments on methane reservoirs tied up in the ocean's continental shelves [clathrates or methane hydrates-JJ] which can be released by a rise of only 0.5 deg C in sea temperature and the methane tied up by tundra reservoirs in permafrost which can also be released by global warming. When the methane, a [27X, (10-20X->by others)] more powerful Greenhouse gas than CO2, is released by global warming and the volumes are plugged in by Modelers, he said there was a tipping point which launched a positive feed-back loop leading to the run-away dooms-day scenario and we might end up looking like Venus. Too hot for life. References on this critical issue: http://www.ipcc.ch/pub/tar/wg1/134.htm http://www.nsc.org/ehc/climate/ccucla5.htm http://www.gaiabooks.co.uk/environment/tundra_warming.html http://www.asf.alaska.edu/daac_documents/cdrom_docs/30228.html http://www.iclei.org/efacts/greengas.htm http://www.ucmp.berkeley.edu/education/events/cowen1c.html http://ethomas.web.wesleyan.edu/ees123/clathrate.htm http://www.mbari.org/ghgases/peerart/hydmodel.html Apparently, tundra wetlands are a massive source of methane and tundra forests are a sink. Which will predominate in global warming is then the question as is the question of what will ocean warming do to the liberation of submarine methane reservoirs and how soon will it happen at present trends? A critical problem assessment needs to be done because there is conflicting data out there.-JJ Clearly we need to do whatever is needed at whatever cost or sacrifice, to ensure that ocean methane reservoirs don't burp. Q? Are there other surprises lurking with the other identified greenhouse gases; ie: nitrous oxide, hydrofluorocarbons, perfluorocarbons, and sulphur hexafluoride, CO2, viz. a viz. release reservoirs? Makes one realize how dangerous President Bush's and Prime Minister Cretien's waffling on environment is.-JJ] 8:30 Dr. Mindy Brugmann, glaciologist-Climate Change Research on Illecilleweat Glacier, Glacier National Park. Mindy said basically that Illecilleweat glacier is retreating as are most glaciers in BC and it is also thinning. These changes are attributed to climate change and are greatly influenced by short term and long term oceanic temperature cycles which in turn are influenced by global warming. There will be important and negative impacts on a variety of parameters including late summer water flow, peak flows, timing of flows, volume of flow, local climate- to name a few. I mentioned the Blake expeditions to the Himalayas and the fact that they found that the melt is highest at higher elevations and Himalayan lakes are threatening to overflow and wipe out huge numbers of people down slope. [My question is: Will global warming temperatures rise more sharply when the majority of glaciers have vanished as they seem to be doing and may the loss of their their moderating influence make a tipping event scenario more likely? Comment: small glaciers have vanished in the past century. See http://www.geocities.com/jormabio/archive/disappearing_glaciers.html -JJ] Coverage of previous similar presentations: http://www.tv.cbc.ca/national/pgminfo/glacier http://www.cmiae.org/research/climatechange.htm Friday, May 31st at Okanagan Regional Library 1380 Ellis Street 9:30 – 4:30 p.m.. Speakers, Workshop and Panel 9:30 Dr. Andrew J. Weaver, FRSC weaver@uvic.ca U Victoria, School of Earth and Ocean Scientists-Topic: What is climate change? Climate change is the statistical analysis of trends in climate parameters, not our subjective assessment of weather based upon memory. Long term measurements are the only way to get at the information and media make mockery of the science by posting nonsensical anecdotal arguments of non-believers and believers. Science is the solution to arguments. Yes, global warming is happening and CO2 has always been involved in it. IPPC 2001 says that there is "New and stronger evidence in the past 50 years that temperature increases are attributable to humans." Global mean 370 ppm is 70 ppm over max ever seen before during interglacial. Both methane and CO2 have shown major peaks in the past 400,000 years and these coincided with major warming during the interglacial epochs. Climate warms during the interglacial due to rising CO2 and cools during the glacial periods but, we have never seen anything like the CO2 levels at present, so there is a real issue to deal with. The Northern hemisphere is, relative to southern latitudes, more affected by greenhouse gases as is the land area and night-time lows are increasing faster than daytime highs. Storm events are increasing in frequency and this will lead to huge costs in infrastructure and insurance. Future projection is 2 degrees Celsius by 2100 if no Kyoto. If Kyoto goes ahead as per present target, temperature will be 1.92 deg C. Kyoto must be strengthened and the goal needs to be strengthened to 4X pre industrial Greenhouse gases so we need to cut emissions by 50% by 2010. Basically, as is Kyoto is irrelevant. Antarctica is warming in the periphery but cooling in the center. No single event is attributable to GG. Policy works, CFC's are down and will be gone in 50 years from now. Make effective policy is the message. We need models and upgrades constantly. Mitigation is likely to fail and is pie in the sky since one solution will create another problem. He used the "The King and the Mice and the Cheese Game" analogy. The only solution was to quit eating cheese. Ergo we need to quit consuming hydrocarbons. [Climate engineering is being thought of by some as a solution to global warming. A reference for those interested in reviewing this controversial ecosystem damaging approach-JJ]: http://www.chooseclimate.org/cleng/cleng.html Alternatives that can work are nuclear, hydrogen fuel cell, and solar and wind. Tidal is being explored by Australia. "Combating global climate change is about global security!" (Investors start moving your money-the best brains are giving a clue to market futures here! However, nuclear is bound to be controversial because of the potential pollution by radio-active substances. Jorma Comment). Dr. Weaver's Climate Website: http://wikyonos.seos.uvic.ca/climate-lab.html 10:00 Guy Dauncy, Author, guydauncy@earthfuture.com http://www.earthfuture.com Author Stormy Weather-topic: Climate Change Solutions. Guy favors a positive approach and also using regulations to drive switching to alternate energy technological innovation and he says there is evidence that investment will follow. Targeted measures are best and do it bit by bit. First in to the alternate technology will capture leadership in global market share and can sell the technology to the world. Heritage solar shingles will be competitive in cost and efficiency possibly as soon as 2005 at $1.00/Watt. 10,000 m^2 of Nevada at 17% efficiency, can supply all of the US power requirements. http://www.zeenrgy.com. North sea aricity of offshore wind shows it as viable alternative and BC has similar potential for wind. Vehicles can go hydrogen gas electric (HGE) for 80 mpg and save enormously on GG's. Alternatives work and can save us. Investment should start immediately. Sinks are a scam and credits are a cop-out, and oil companies have shown that they can increase their efficiency enormously and thereby save on GG's and GW. For full and actual text see below. Full detailed talk available at: http://www.geocities.com/jormabio/climate/guy_skelownapaper.doc 10:30 Jim Vanderwal, jvanderwal@fraserbasin.bc.ca BC Climate Exchange (formerly the HUB Public Education and Outreach Office) and Fraser Basin Council. Jim gave a number of web sites where good things can be found. His organization acts through improving education and corporate behavior. they are involved in transportation, education and teachers. He talks about sustainable industry, energy efficiency, green buildings, workplace education, renewable energy, smartgrowth, and mobilization by connecting to personal interests, leadership and by providing a clearinghouse for educational resources. He provides web sites which promote aspects of their approach and his group is actively involved in web site development. Web Sites of interest suggested by Jim: http://www.betterbuildings.ca http://www.bcyhdro.com http://www.kepp.org http://www.energy.ca http://www.energyaware.bc.ca http://www.best.bc.ca http://www.nccp.ca http://www.fraserbasin.bc.ca 10:45 Rob Scherer, Forest Research Extension Partnership (FORREX), Extension Specialist with the Watershed Management Program at Okanagan University College. Rob talked about Dr. Peter Dill's work with Kokanee which are being stressed by increasing stream temperatures. Eggs are killed by stream temps over 14 deg C and these are more and more common in recent times. Spawning success also affected. Looking for solutions like using reservoirs to maintain water supply. A guest raised the question of impacts of climate change on forestry. Two issues arose. Bark beetles and migration of ecosystems. I had researched this issue previously and mentioned that bark beetles are in epidemic now because extremes of cold temperature are no longer happening due to global warming and so the beetles are surviving winters. Adding to this are fire protection forest management practices which have created huge stands of vulnerable mature pine, and therefore the cost of beetle recovery is directly attributable to global warming. [Fires used to take these stands out naturally in pre-contact times.] I mentioned also that hardwood forests are migrating northwards displacing our softwoods. I disagreed with him on the ability of ecosystems to adapt in all cases. I had seen modeling work from American scientists predicting that ecosystem migration rates may exceed the adaptation rate of many species. The Chairman brought up the issue that tree species being planted today need to be those than can tolerate the changed ecosystems of tomorrow. [For forest management purposes in BC, ecosystems are differentiated on the basis of temperature, moisture and nutrients to name a few parameters, and temperature and moisture are certainly changing due to global warming phenomena]. Access information: http://www.forrex.org/home/home.asp http://royal.okanagan.bc.ca/kokanee/links.htm 11:00 Russ Haycock, http://www.fcm.ca Federation of Canadian Municipalities The FCM Partners for Protection program. Russ has been involved in 25 Municipal Greenhouse Action Plans and is a great contact for cities like Kelowna. Russ explained that there exists a Federation of Canadian Municipalities for Sustainable Development and they have Formed Partners for Climate Protection with objectives-Reduce Greenhouse gas emissions, Develop local action plans, lead by example and collaboration, and provide 50% Green funds for action plans. Municipalities can show leadership and make enormous saving in energy and reduce emissions by things like; building retrofits, diverting solid wastes, upgrading water and waste water treatment facilities, improving the vehicle fleets etc. He suggests that people get a Political Champion to help move these objectives through communities and that we think Global. Material available at: http://www.fcm.ca/newfcm/Java/frame.htm 11:15 Lunch 12:30 Marnie Olson BEd. and Deb Calderone, marnie.olson@gvrd.bc.ca Whats the Fuss? GVRD Climate Change Workshop. Material and support for education on climate change for teachers available at the web site below or by contacting Marnie or Deb. Excellent teaching resources and workshop techniques for teachers of Socials Studies or Earth Sciences 11 especially but also good for teacher training workshops on this subject. Brainstorming technique application. Really gets climate issues through to students. Four terrific booklets, Poster, and other resources available. The booklets are: 1. Lets Clear the Air, Intermediate air quality education program. GVRD. 2. What's all the fuss? Climate Change Teaching strategies with the 'Temperature Rising' poster for Southwestern British Columbia. A curriculum to explore the concepts of our connection to climate change concerns, causes, potential impacts and possible actions. 3. Pamphlet. Lets Clear the Air. A primary activity book. GCRD. 4. Pamphlet. Climate Change in the Classroom. 8 pages. Make sure you ask for the posters. Our Workshop study group reviewed sea level rise and came up with impacts including huge numbers of deaths, and dislocatons, increase in hunger and starvation and population densities inland, loss of fisheries and agriculture, increased costs of everything. Famine and disease. In southern BC we would lose Lulu Island, Delta, Richmond, Steveston; Roberts Bank, the International Airport at Vancouver, Ports and Estuary facilities all over BC, fisheries production from estuaries, and tsunami dangers would also increase enormously. All the homes and work places there would be rendered worthless. People would have to move and they would lose their jobs. Places like Indonesia and Bangladesh would lose enormous amounts of land and homes for people and liveli-hoods and many would die or be dislocated to refugee camps. Fish and wildlife and biodiversity would suffer enormously globally. Contact and materials at: http://www.gvrd.bc.ca 2:30 Water Issues Panel- Participants: Neil Klassen, Kelowna Water Smart; Up costs & Conservation message. stewardship@sylix.org; Michelle Boshard, Brian Symonds, Dr. Denise Neilson Phd, Research Scientist, Ag. Cda.NEILSEND@EM.AGR.CA Denise talked about forthcoming water issues for orchard tree crops related to projected climate warming and concluded that there would be a longer summer season with considerably hotter earlier spring and an extended fall. There would be an increase of 28% by 2050 for plant water demand and 37% increased irrigation demand. Demand will exceed supply in tributary drainage orchards. She discussed how we might adapt and cited a number of options a few of which include change species, move upslope, improve conservation, and promote subsurface drip. Contact and study available through:http://res.agr.ca/summer/parc.htm Howie Right; Okanagan Aboriginal Peoples' Fisheries Commission. Expressed specific concerns for Kokanee Fisheries Resource and issues surrounding development impacts and water supply. Also cut-backs by FRBC WRP for fisheries habitat restoration projects. Howie cited a number of WRP past projects completed. Severe decline of stocks has resulted from changes brought about by growth of human population in the Okanagan to the point where they are no longer used as a food fish. A participant informed me that there were pesticide toxicology studies underway on the Okanagan lake fish presently. Though Howie gave me no reference, for those interested in the plight of the kokanee I suggest the following link: http://royal.okanagan.bc.ca/kokanee/links.htm Wendy Avis, See above, Day 1. Tina Neale; tneale@sdri.ubc.ca Tina gave a mini presentation similar to yesterdays regarding research paper; 'Water Management and Climate Change in the Okanagan Basin' by Stewart Cohen and Tanuja Kulkarni. Environment Cda and UBC. Paper available from: scohen@sdri.ubc.ca Web Site Hosted by Jorma Jyrkkanen, Forum Participantjormabio@hotmail.com To see what is happening to global temperatures by hemisphere and Northern Hemisphere (NH) from dendroclimatology in particular; you may wish to visit the following sites: http://www.cru.uea.ac.uk/cru/climon/data/themi/ http://www.ngdc.noaa.gov/paleo/ei/ei_reconsa.html To monitor the climate see http://www.cru.uea.ac.uk/cru/climon/ The sun is in a hot cycle or trend at present so it appears to be having an impact on warming. Volcanic dust and gases have been postulated to cool equatorial waters in the past reducing the north-south sea temperature gradient thereby stopping ocean transport of heat and oxygen leading to a sinking of warm water and a disasterous methane degassing. To see what role volcanic dust and solar inputs might play relative to carbon dioxide and NH temperature see this site: http://www.ngdc.noaa.gov/paleo/ei/ei_reconsc.html To see what folks in California just south of us have found due to climate change and what they are thinking about and doing about global warming, check out this site: http://www.caglobalwarming.org/ What was noteworthy about this Forum is that none of the experts disputed that there was a problem or that we needed to take effective measures and to act more decisively than we have done to date. The 'methane hydrates' or 'clathrates' issue is not going to go away. It is an unknown in the global warming equation, with a devastating potential if we tweak the wrong buttons. The earth might be able to recover from a methane hydrate meltdown but probably not before Crockodilians were living in Norway again. If the cold water current stops circulating cold Arctic water to the Atlantic deep, there could be a severe warming of the tropical and temperate seas with devastating consequences for methane release from these clathrates. This scenario is one possibility after the Arctic Ice vanishes in about 2050 (My theory, 2004). More than anything, this issue points to the fact that we need a pro-active high profile green world leader to champion the cause of global warming and we need immediate commitments by all nations, rich and poor, to fight for a clean planet living in sustainable harmony with its ecosphere. Striking was the positive tone of this forum based on the fact that there are many solutions but we need to act and get the economy working alongside of science to solve these problems and create a survivable future for our planet. The opportunity created by these vital challenges is enormous and should be seen as a positive incentive for political policy and social infrastructure and money markets to move into efficiency technology and enhanced sustainability. This initiative would also enhance global security. Young people need to be at the leading edge of this movement. Another very useful organization to link with which enables researchers with funding and in developing adaptation action strategies is the C-CIARN BC Climate Exchange which can be accessed at BC-CIARN Jorma. original at http://www.geocities.com/jormabio/index.html now no longer operative. Copyright 2002 Jorma Jyrkkanen. All rights reserved. 0 00 Posts with tag Mercury Link to Arctic Fox Declines Probably due to Atmospheric Acidic Accumulation Sudden Formation of Greenland Ice Sheet Suggested by Pine in Basal Core. Global Atmospheric CO2 passes 400 ppm First Time in Two Million Years No comments yet Post a new comment jorma_jyrkkanen May 15 2013, 09:22 0 00 Mercury Link to Arctic Fox Declines Probably due to Atmospheric Acidic Accumulation Mercury Link to Arctic Fox Declines Probably due to Atmospheric Acidic Accumulation 15 May 2013 Arctic fox are in decline and the culprit is thought to be mercury. So why is it suddenly a problem? Its not. The problem has been building for some time. http://www.bbc.co.uk/news/science-environment-22425219 The Arctic is a collecting area for northern hemispheric global winds where gases in those winds cool and volatile substances condense and drop onto the substrate, be it water, ice or land. One of the biggest most dangerous components of those winds are the acids with pesticides a close runner up. There is sulfur dioxide (SO2), sulfuric acid (H2SO4) and many kinds of sulfur gases in abundance from various north hemispheric mills and there is also nitrous oxide (N2O) and the ever ubiquitous CO2. These are gaseous green house gas spin offs of fossil fuel combustion that excacerbate the impacts of global warming on animal species. When you acidify soils, bound mercury becomes labile and enters the water runoff. It is likely that the sequestering capacity of the oceans are already full for CO2 with conversion of CO2 into acid and return to the atmospheric buildup. The addition of these other anthropogenic acids probably contributes to reducing ocean sequestering even more and adds to higher acidity overall and increases mercury lability and mobility into the Arctic ocean and up the food chain. This is likely the story in the Arctic. When it reaches the oceans, bacteria convert it to more bioconcentrating forms which then move up the food chain and into those animals like seals and whales which Arctic fox feed upon. This problem is more acute in the arctic because there is circumpolar drainage into arctic waters from northern hemisphere rivers draining the zones of acid accumulation. Canada, the USA, China, Russia and the EU have many mills spewing these contaminants into global air sheds. Mercury once bound in the benthic sediment is possibly being made more labile and water soluble by bacterial action. Many predator fish have elevated mercury simply due to natural mercury in the environment. Excretion normally balances that out at survivable levels, but the balance is narrow for larger predators and can easily be exceeded. Tuna and Shark and Swordfish for example have naturally high levels. The bad news is that if fox are being polluted and reproduction is declining, then sea birds, fish eating eagles, polar bears and Orcas are probably not far behind because mercy affects not only nervous systems, but targets the reproductive systems of many species. Copyright Jorma Jyrkkanen. All rights reserved.

Tuesday, June 21, 2022

Covid Vaccines Effectiveness at Preventing Illness and Death post Vaccination. 2022-06-21. Ref. Professor Peter Nordstrom. Lancet. Jorma Jyrkkanen Also addenda.

Articles| Volume 399, ISSUE 10327, P814-823, February 26, 2022 Risk of infection, hospitalisation, and death up to 9 months after a second dose of COVID-19 vaccine: a retrospective, total population cohort study in Sweden Prof Peter Nordström, PhD. Peer Reviewe. Marcel Ballin, MSc Anna Nordström, PhD Findings Between Dec 28, 2020, and Oct 4, 2021, 842 974 individuals were fully vaccinated (two doses), and were matched (1:1) to an equal number of unvaccinated individuals (total study cohort n=1 685 948). For the outcome SARS-CoV-2 infection of any severity, the vaccine effectiveness of BNT162b2 waned progressively over time, from 92% (95% CI 92 to 93; p<0·001) at 15–30 days, to 47% (39 to 55; p<0·001) at 121–180 days, and to 23% (−2 to 41; p=0·07) from day 211 onwards. Waning was slightly slower for mRNA-1273, with a vaccine effectiveness of 96% (94 to 97; p<0·001) at 15–30 days and 59% (18 to 79; p=0·012) from day 181 onwards. Waning was also slightly slower for heterologous ChAdOx1 nCoV-19 plus an mRNA vaccine, for which vaccine effectiveness was 89% (79 to 94; p<0·001) at 15–30 days and 66% (41 to 80; p<0·001) from day 121 onwards. By contrast, vaccine effectiveness for homologous ChAdOx1 nCoV-19 vaccine was 68% (52 to 79; p<0·001) at 15–30 days, with no detectable effectiveness from day 121 onwards (−19% [–98 to 28]; p=0·49). For the outcome of severe COVID-19, vaccine effectiveness waned from 89% (82 to 93; p<0·001) at 15–30 days to 64% (44 to 77; p<0·001) from day 121 onwards. Overall, there was some evidence for lower vaccine effectiveness in men than in women and in older individuals than in younger individuals. SSRM Serious Adverse Events of Special Interest Following mRNA Vaccination in Randomized Trials Pre-Print not peer Reviewed. 22 Pages Posted: 23 Jun 2022. Fraiman, Joseph and Erviti, Juan and Jones, Mark and Greenland, Sander and Whelan, Patrick and Kaplan, Robert M. and Doshi, Peter, Serious Adverse Events of Special Interest Following mRNA Vaccination in Randomized Trials. Available at SSRN: https://ssrn.com/abstract=4125239 “Pfizer and Moderna mRNA COVID-19 vaccines were associated with an increased risk of serious adverse events of special interest, with an absolute risk increase of 10.1 and 15.1 per 10,000 vaccinated over placebo baselines of 17.6 and 42.2 (95% CI -0.4 to 20.6 and -3.6 to 33.8), respectively,” the researchers found. “Combined, the mRNA vaccines were associated with an absolute risk increase of serious adverse events of special interest of 12.5 per 10,000 (95% CI 2.1 to 22.9).”

Posture Change may Result in Dysfunction of Heart Rate Response in Some Long Haul Covidians. 2022-06-21. Jorma Jyrkkanen

REF:WebMD.
Covid Side Effects Continued. COVID-19 and POTS: What You Should Know In this Article What Is POTS? How Is POTS Linked to COVID-19? Who Gets Post-COVID POTS? What Can You Do? How Do Doctors Diagnose Post-COVID POTS? How Do Doctors Treat Post-COVID POTS? There is some evidence that the coronavirus that causes COVID-19 may also trigger a condition called postural orthostatic tachycardia syndrome (POTS) in people with long-haul COVID-19 (people who have recovered from the initial illness but still have lingering symptoms). What Is POTS? POTS is a debilitating condition that causes your heart to speed up by at least 30 beats per minute after you move from sitting or lying down to standing. This happens when your body’s autonomic nervous system, which should work automatically, fails to control your blood pressure and heart rate to make up for your change in posture. It doesn’t always happen immediately. It can sometimes take as long as 10 minutes after you stand. You may get dizzy and even faint. POTS isn’t well-known. Many people with the condition report that it took them quite a while to get a diagnosis. How Is POTS Linked to COVID-19? POTS can be triggered by a number of things like infection or surgery. But viruses or bacteria seem to trigger it most often, and some scientists think the coronavirus might be among them. That’s because some people who recovered from COVID-19 seem to have POTS-like symptoms like: A faster heart rate with slight increase in activity Trouble thinking (brain fog) Lightheadedness Headaches Nausea and vomiting Extreme tiredness that won’t go away (severe chronic fatigue) Who Gets Post-COVID POTS? It appears that anyone who has had COVID-19 can get POTS, whether the virus initially caused serious symptoms or mild ones. But there are some things that seem to raise your risk for post-COVID POTS, though scientists aren’t yet sure about them. These include a pre-COVID history of: Concussion Dizziness Lightheadedness or passing out Racing or skipping heart (palpitations) A faulty immune system that mistakenly attacks your body’s tissues (autoimmune response) also seems to play a part in POTS. People with POTS tend to have higher rates of autoimmune markers like those from thyroid disease, rheumatoid arthritis, and celiac disease. They also have signs of inflammation, including in the heart. COVID-19 may also be a cause of this autoimmune response, though more study is needed.

Friday, May 6, 2022

Fired Pfizer Whistleblower Raises Serious Concerns on Safety Protocol Procedures. 2022-05-06

British Medical Journal Investigation Covid-19: Researcher blows the whistle on data integrity issues in Pfizer’s vaccine trial BMJ 2021; 375 doi: https://doi.org/10.1136/bmj.n2635 (Published 02 November 2021) Cite this as: BMJ 2021;375:n2635 Report of Paul D Thacker, investigative journalist Revelations of poor practices at a contract research company helping to carry out Pfizer’s pivotal covid-19 vaccine trial raise questions about data integrity and regulatory oversight. Paul D Thacker reports https://www.youtube.com/watch?v=RaLxhFiOBYk

Covid Linked Diabetes, kidney disease, heart failure and stroke risk increase found by St Louis VA Healthcare Epidemiologists. 2022-05-06. Jorma Jyrkkanen

Covid Linked Diabetes, kidney disease, heart failure and stroke risk increase found by St Louis VA Healthcare Epidemiologists. 2022-05-06. Jorma Jyrkkanen
Risks amplified Al-Aly and Yan Xie, an epidemiologist also at the VA St Louis Healthcare System, looked at the medical records of more than 180,000 people who had survived for longer than a month after catching COVID-19. They compared these with records from two groups, each of which comprised around four million people without SARS-CoV-2 infection who had used the VA health-care system, either before or during the pandemic. The pair previously used a similar method to show that COVID-19 increases the risk of kidney disease3, heart failure and stroke. The latest analysis found that people who had had COVID-19 were about 40% more likely to develop diabetes up to a year later than were veterans in the control groups. That meant that for every 1,000 people studied in each group, roughly 13 more individuals in the COVID-19 group were diagnosed with diabetes. Almost all cases detected were type 2 diabetes, in which the body becomes resistant to or doesn’t produce enough insulin. The chance of developing diabetes rose with increasing severity of COVID-19. People who were hospitalized or admitted to intensive care had roughly triple the risk compared with control individuals who did not have COVID-19. Even people who had mild infections and no previous risk factors for diabetes had increased odds of developing the chronic condition, says Al-Aly. Of the people with COVID-19 who avoided hospitalization, an extra 8 people out of every 1,000 studied had developed diabetes a year later compared with people who were not infected. People with a high body-mass index, a measure of obesity — and a considerable risk factor for type 2 diabetes — had more than double the risk of developing diabetes after a SARS-CoV-2 infection.

Royal Rife Antiparasitical Cancer Kill Experimental Frequencies. Jorma Jyrkkanen, Researcher 2026-06-07

THE FREQUENCIES THAT ARE PURPLRTED TO HAVE CURED TERMINAL CANCER PATIENTS ARE SUPPOSEDLY INCLUDED HERE. I AM NOT A DOCTOR AND CANNOT PRESC...